The Art and Science of Technical Analysis: Insights for Wealth Generation
Markets are dynamic, constantly shifting between bullish optimism and bearish pessimism. This volatility can seem chaotic to the untrained eye, but traders use technical analysis is for Wealth Generation to find order within this chaos.
Rooted in the 18th century, technical analysis owes much to Munehisa Homma, a Japanese rice trader, who developed the candlestick method. Homma’s innovation was introduced to the modern world through Steve Nison’s groundbreaking book, Japanese Candlestick Charting Techniques, published in 1991.
By analyzing patterns, trends, and market psychology, technical analysis equips traders with the tools to navigate financial markets with precision. Whether you’re trading stocks, forex, commodities, or cryptocurrencies, understanding these tools can transform trading from speculative gambling into a structured strategy for wealth generation.

Technical Analysis
The Basics of Technical Analysis for Wealth Generation
What Is Technical Analysis?
Technical analysis involves examining historical price movements to predict future market behavior. Unlike fundamental analysis, which focuses on a company’s financials or the macroeconomic environment, technical analysis emphasizes price, volume, and patterns.
Why Technical Analysis Works
Market Psychology: Prices reflect the collective sentiment of market participants.
Repetition: Human behavior tends to repeat, leading to recurring patterns.
Universal Application: Charts and techniques can be applied across all asset classes.
Candlestick Charts: The Foundation of Technical Analysis for Wealth Generation
Candlestick charts are visual representations of market movements during specific time frames. Each candle has four key components:
Open Price: The first price traded during the time frame.
Close Price: The last price traded during the time frame.
High Price: The highest price reached during the time frame.
Low Price: The lowest price reached during the time frame.
Reading Candlesticks
Bullish Candle (Green/White): Closes higher than it opens, showing upward momentum.
Bearish Candle (Red/Black): Closes lower than it opens, indicating downward momentum.
Why Candlesticks Are Essential
Candlesticks convey market psychology, revealing who is in control—buyers or sellers—and signaling potential reversals or continuations.
Common Candlestick Patterns for Wealth Generation
Bullish Patterns
Hammer:
Forms at the bottom of a downtrend.
A small body with a long lower wick, indicating buyers have pushed the price upward.
Example: After a prolonged downtrend, a hammer on the daily chart might indicate a reversal.
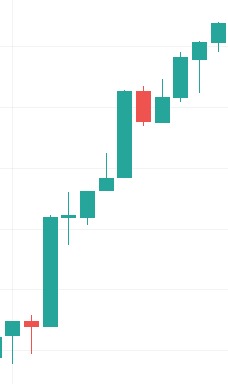
Hammer (Bullish)
Morning Star:
A three-candle pattern signaling the reversal of a bearish trend.
Comprises a bearish candle, a small indecisive candle, and a bullish candle.
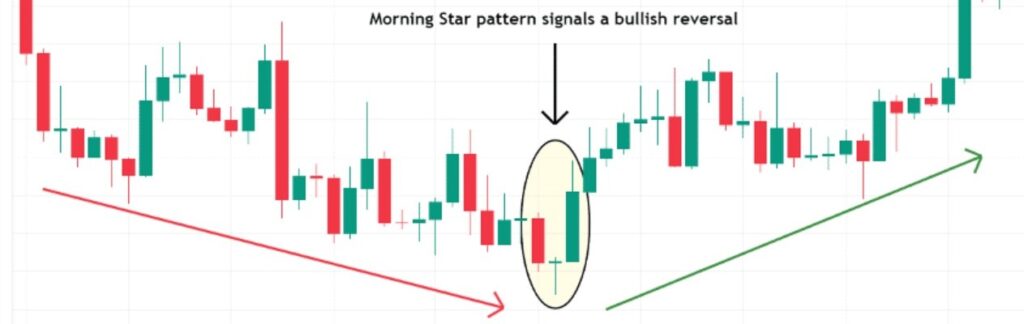
Morning Star (Bullish)
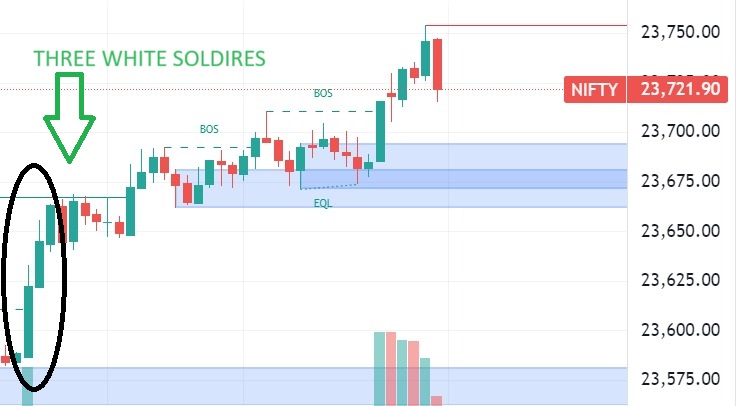
Three White Soldiers:
Three consecutive bullish candles with higher closes, signaling strong buying momentum.
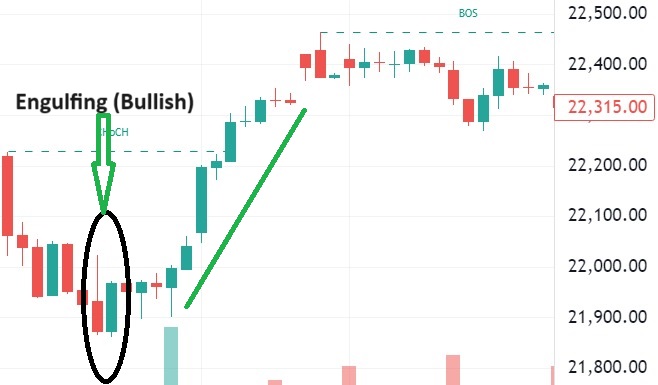
Bullish Engulfing:
A large bullish candle engulfs the previous bearish candle, showing a decisive shift in control to buyers.
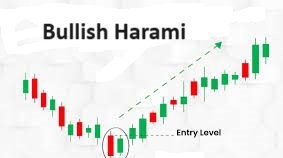
Bullish Harami
A smaller bullish candle forms within the range of a larger bearish candle, often marking the beginning of an upward move.
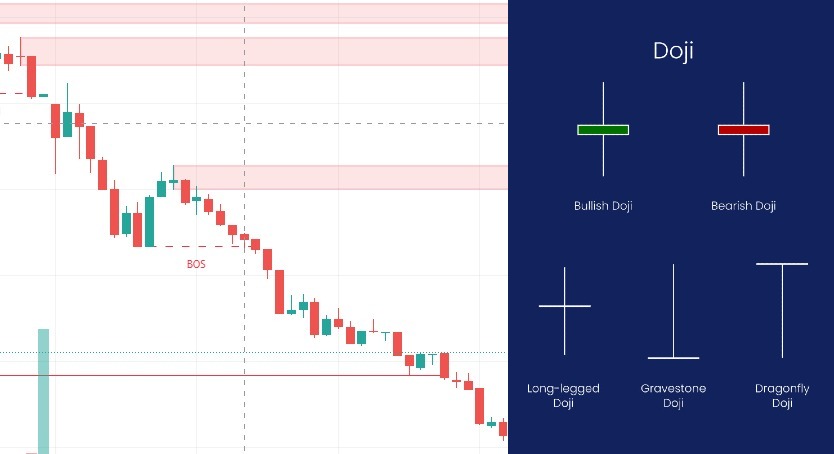
Doji Patterns
Dragonfly Doji: A bullish reversal pattern with a long lower shadow and no upper shadow.
Gravestone Doji: Indicates potential bearish reversal despite a bullish run.
Bearish Candlestick Patterns
Bearish patterns warn of potential downward movements or trend reversals.
Bearish Patterns
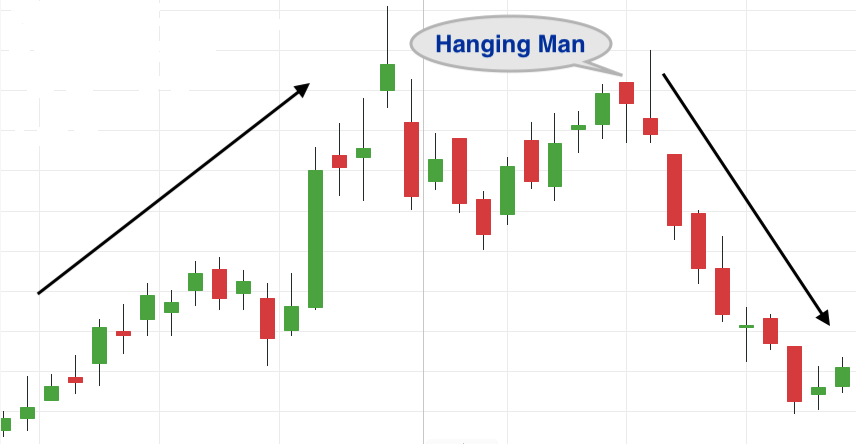
Hanging Man:
Appears at the top of an uptrend. A small body with a long lower wick suggests weakening bullish momentum.
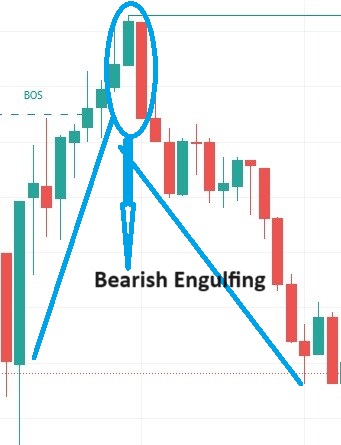
Bearish Engulfing:
A large bearish candle engulfs the previous bullish candle, signaling a reversal.
Evening Star:
A three-candle pattern that signals the end of an uptrend, with the final candle being bearish.
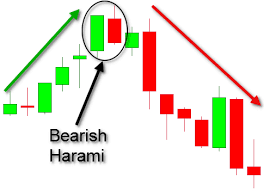
Bearish Harami
A smaller bearish candle forms within the range of a larger bullish candle, indicating potential downside.
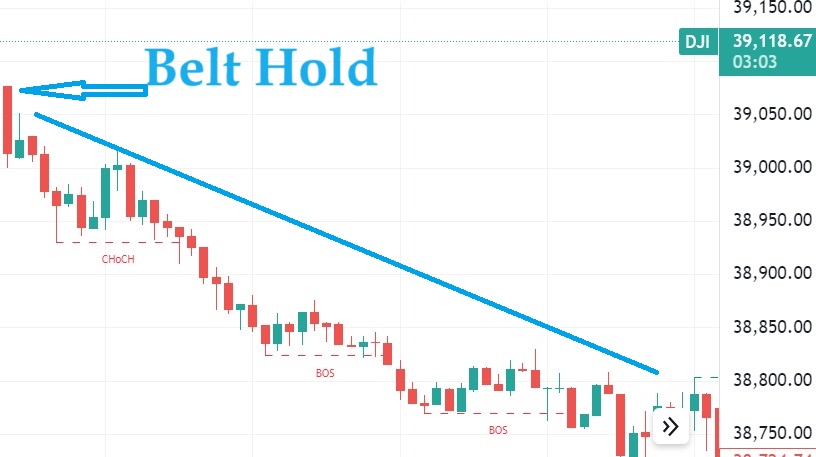
Belt Hold
A single bearish candle opens near its high and closes near its low, showing strong selling momentum.
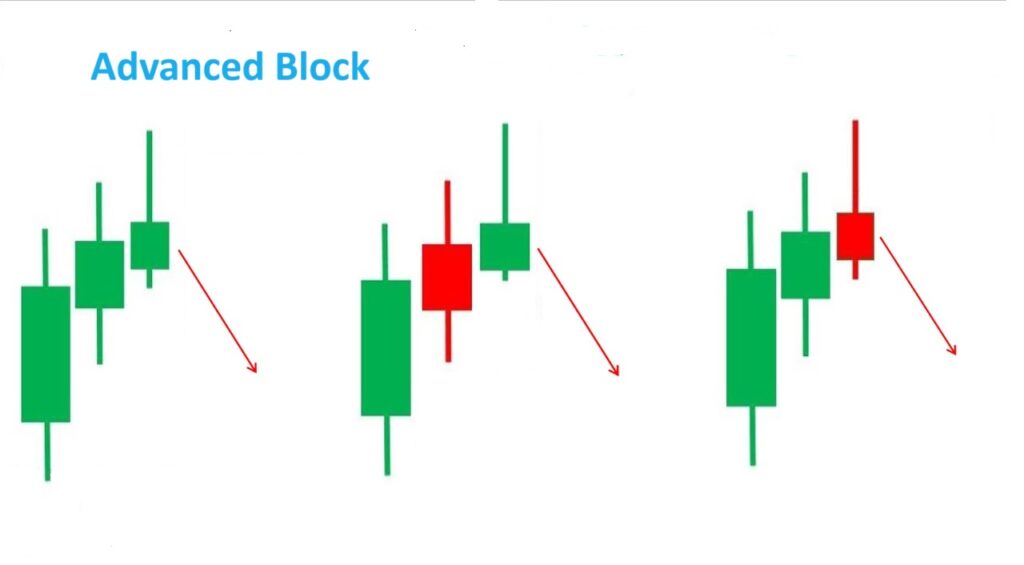
Advance Block:
Consists of three bullish candles with diminishing size, indicating weakening upward momentum.
Expanding Beyond Candlestick Patterns
While candlesticks are invaluable, combining them with other tools enhances the accuracy of technical analysis.
Trend Analysis
Traders use trend lines and channels to identify the general direction of the market.
Uptrend: A series of higher highs and higher lows.
Downtrend: A series of lower highs and lower lows.
Sideways Trend: Price moves within a range, indicating consolidation.
Support and Resistance
Support: A price level where buying pressure prevents further decline.
Resistance: A price level where selling pressure prevents further rise.
Indicators
Moving Averages (MA): Smooth out price data to identify trends.
Simple MA (SMA): Average of prices over a specific period.
Exponential MA (EMA): Gives more weight to recent prices.
Relative Strength Index (RSI): Measures the speed and change of price movements, identifying overbought or oversold conditions.
MACD (Moving Average Convergence Divergence): Combines moving averages to identify potential buy and sell signals.
Volume Analysis: Confirms the strength of price movements. A breakout with high volume is more reliable than one with low volume.
Advantages of Technical Analysis for Wealth Generation
Objective Decision-Making
Provides clear signals for entry and exit points, minimizing emotional biases.
Adaptability
Works across all markets and time frames, from scalping to long-term investing.
Risk Management
Allows traders to set stop-loss and take-profit levels based on chart analysis.
Efficiency
Focuses solely on price action, saving time compared to exhaustive fundamental analysis.
Misconceptions About Technical Analysis
“It’s Only for Day Traders”
While popular among day traders, technical analysis is equally valuable for swing and position traders.
“It’s Not Reliable”
No method is foolproof, but combining technical analysis with risk management strategies significantly improves outcomes.
“It Ignores Fundamentals”
Technical analysis complements, rather than replaces, fundamental analysis.
Combining Fundamental and Technical Analysis
Successful traders often blend both approaches:
Use fundamental analysis to identify undervalued assets.
Use technical analysis to time entry and exit points effectively.
For instance, a trader might identify a stock with strong earnings growth and wait for a bullish engulfing pattern on the chart before buying.
Practical Applications in Wealth Generation
Identifying Trends Early
Spot emerging trends using candlestick patterns and indicators to ride significant price movements.
Minimizing Losses
Set stop-loss levels below support levels to protect against sudden downturns.
Diversifying Strategies
Apply technical analysis across various asset classes, such as commodities, forex, and cryptocurrencies, to mitigate risks.
Gaining an Edge in Volatile Markets
Patterns like the hammer or evening star often shine in volatile conditions, providing actionable insights.
Conclusion
Technical analysis is not just a tool; it’s a disciplined approach to navigating the complexities of financial markets. From the timeless candlestick patterns pioneered by Munehisa Homma to advanced indicators, these techniques empower traders to make informed decisions.
By mastering the art of technical analysis, traders can move beyond speculation, leveraging data-driven strategies to generate wealth. The key lies in continuous learning, practice, and the prudent application of these tools.
Start your journey with candlestick patterns, and let the charts guide your path to financial success.